A large part of our waking hours is spent at work, and for those in an office, it becomes a kind of second home. Because of this, the condition of the breakroom, restrooms, and overall work environment affects our job experience. Keeping these areas clean protects employees’ health, prevents the spread of illness, and creates a space where workers feel comfortable and can focus on their responsibilities.
The cleanliness of a workplace, however, depends on more than just company priorities. Local laws, available resources, and even population density all influence whether employees work in a healthy setting or face daily risks. The presence of cleaning staff, access to paid sick leave, and air quality are just a few of the factors that contribute to overall workplace hygiene. Some states implement strong protections and resources, while others leave gaps that can pose serious risks for workers.
To highlight which states are succeeding and which ones are struggling, Stratus Building Solutions has developed a comprehensive ranking of all 50 states, showing where workplaces are at their healthiest and where they need improvement.
Embed This Infographic on Your Site
Copy and paste to share the Workplace Cleanliness Index:
What Are the Cleanest Workplaces in America?
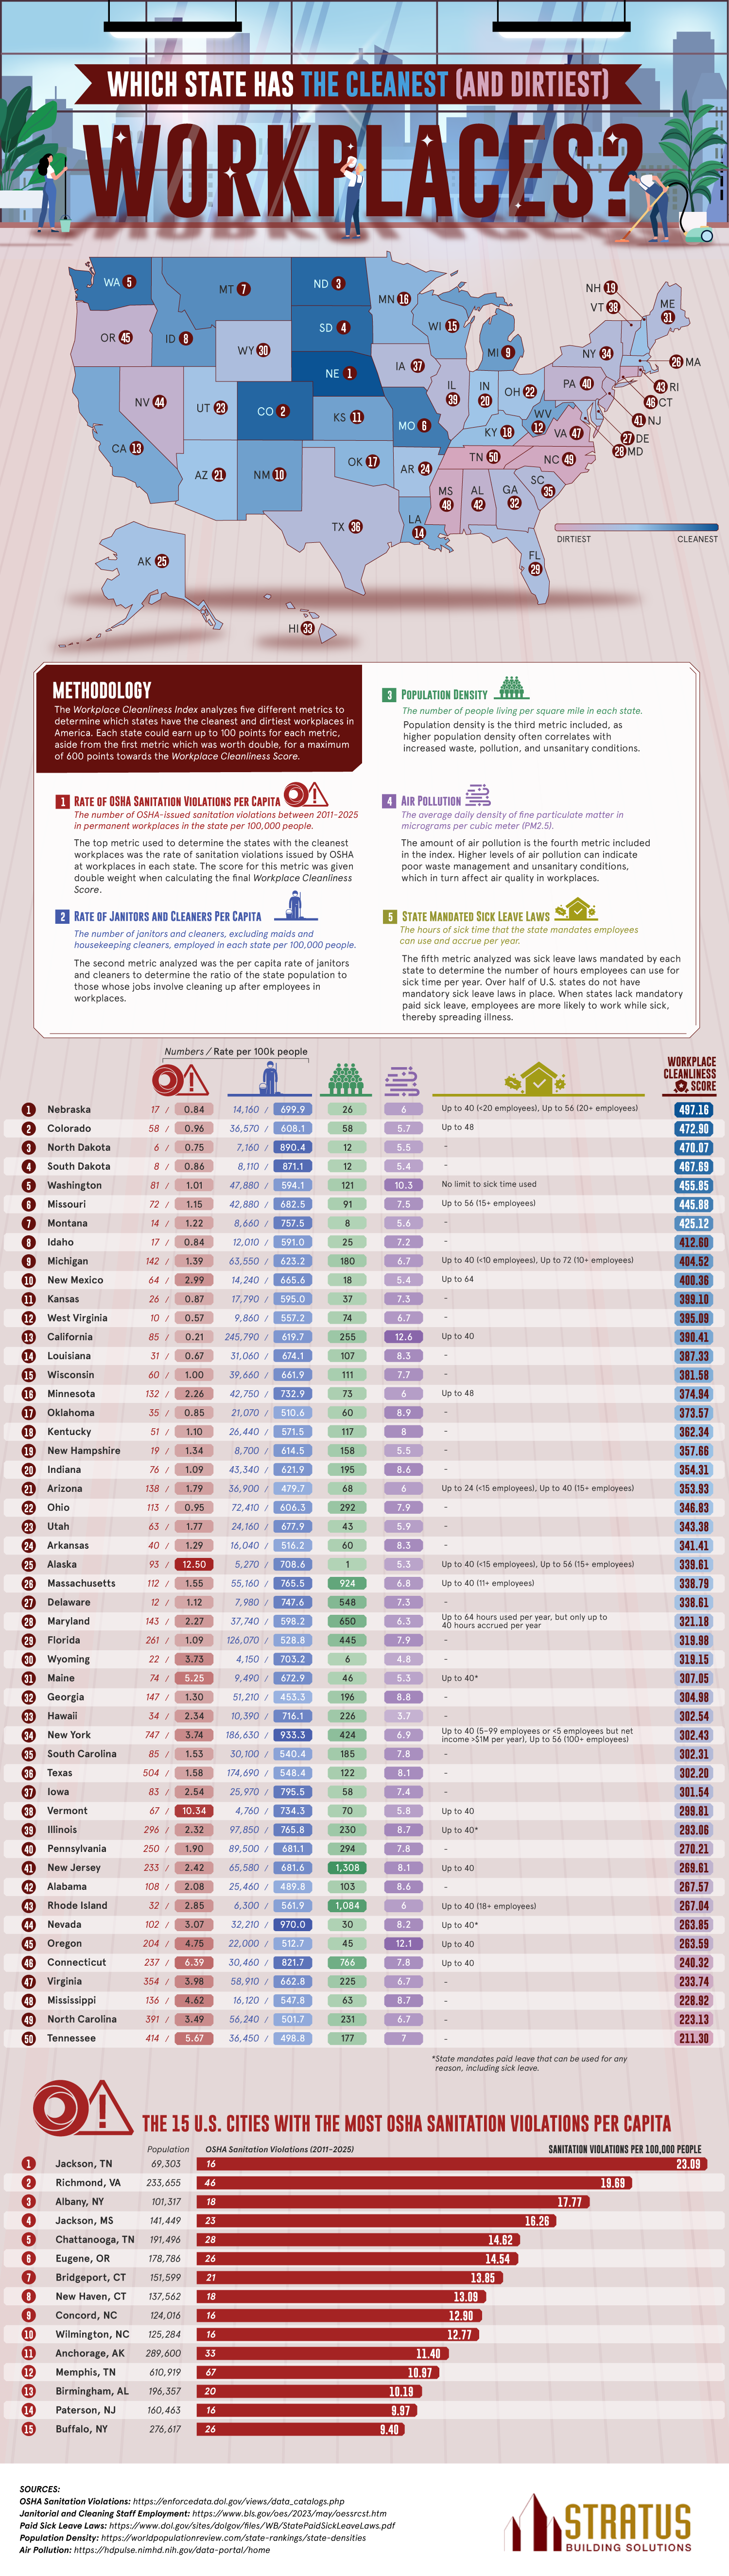
Our Workplace Cleanliness Index combines five key metrics: OSHA sanitation violations, the number of janitors and cleaners per capita, population density, air pollution, and state-mandated paid sick leave laws. Each metric helps paint a clearer picture of workplace safety and sanitation across the nation.
At the top of the list, Nebraska, Colorado, and North Dakota scored high because of their low violation rates, strong ratios of janitors to residents, and relatively clean air. These states might not be the most densely populated, but their balance of workplace regulations and staffing levels helps create healthier environments.
By contrast, states ranking as the dirtiest workplaces in the U.S., including Tennessee, North Carolina, and Mississippi, show the combined effects of high violation rates, low ratios of cleaning staff, and limited or nonexistent paid sick leave. In Tennessee’s case, the high number of recorded violations, combined with the lack of statewide sick leave protections, explains why it ranks last.
Some states stand out for specific categories. New York, for example, employs a large number of janitors and cleaners per capita, yet still falls toward the bottom half of the ranking due to high violation rates and poor air quality. Vermont reported one of the highest per capita rates of sanitation violations, despite its relatively low population density, showing that violations can occur regardless of state size or population density.
OSHA Sanitation Violations
The Occupational Safety and Health Administration (OSHA) sets federal standards for workplace safety, and a sanitation violation indicates that a business has failed to meet basic hygiene requirements. One of the clearest indicators of workplace cleanliness is the number of OSHA sanitation violations issued in a state. These violations relate to conditions such as unclean restrooms, lack of running water, improper waste disposal, or other basic sanitary failures. States with fewer violations per capita generally maintain higher standards, whereas those with higher rates may indicate that businesses are struggling (or outright neglecting) to meet essential requirements.
For example, Nebraska ranked number one overall with one of the lowest rates of OSHA sanitation violations in the country, at fewer than one per 100,000 people. On the other end of the spectrum, states like Tennessee and Alaska reported some of the highest violation rates. Tennessee, which placed last in the overall ranking, had over 400 sanitation violations recorded, equating to more than five per 100,000 residents, indicating there may be systemic issues in maintaining workplace hygiene standards across the state.
Cleanliness in the Workplace and Worker Health
Workplace cleanliness has a direct and undeniable impact on the health of employees. Unsanitary conditions and infrequent cleaning increase the risk of bacteria, mold, and viruses spreading in shared spaces. Workers in poorly sanitized environments are more prone to respiratory problems, gastrointestinal issues, and other health complications. Even simple steps, like disinfecting high-touch surfaces or providing proper handwashing stations, can significantly reduce workplace illnesses.
Paid sick leave also plays a vital role in limiting the spread of illness. Without mandatory paid sick time, employees may feel pressured to work while ill, risking exposing others. States like Washington and California have mandated paid sick leave policies, which help reduce the spread of contagious diseases in workplaces. Meanwhile, more than half of U.S. states still lack these requirements. Tennessee, North Carolina, and Mississippi are among the states without paid sick leave, which can worsen their sanitation issues by forcing sick workers to come to the office.
Population density and air quality further influence workplace cleanliness. Heavily populated states, such as New Jersey and New York, face more sanitation challenges due to the sheer number of people working in concentrated areas. Air pollution adds another layer of concern, as workers exposed to high levels of particulate matter are at greater risk for asthma and other respiratory illnesses. States like Oregon and California, which struggle with poor air quality, also reflect these risks in their rankings.
A clean workplace is a healthy workplace. Along with protecting workers and reducing illness, a clean and comfortable working environment is also beneficial for overall productivity.
While employers have a responsibility to go beyond compliance and take proactive steps to ensure cleanliness, they don’t have to face this challenge alone. Professional cleaning services can help maintain standards that protect employees while creating a more welcoming environment for everyone.
Stratus Building Solutions collaborates with businesses to provide reliable and professional cleaning solutions that maintain a safe and healthy work environment. If you want to protect your employees and improve your work setting, now is the time to act. Contact Stratus today to learn how expert cleaning services can support your office and safeguard your team.
The U.S. Workplace Cleanliness Index
| State | No. of Sanitation Violations | Rate of Sanitation Violations per 100k People | No. of Janitors and Cleaners Employed | Rate of Janitors and Cleaners per 100k People | Population Density | Air Pollution Particle Matter | Hours of Sick Time Employees Can Use and Accrue per Year | Workplace Cleanliness Score |
1 | Nebraska | 17 | 0.84 | 14,160 | 699.9 | 26 | 6 | Up to 40 (<20 employees), Up to 56 (20+ employees) | 497.16 |
2 | Colorado | 58 | 0.96 | 36,570 | 608.1 | 58 | 5.7 | Up to 48 | 472.90 |
3 | North Dakota | 6 | 0.75 | 7,160 | 890.4 | 12 | 5.5 | - | 470.07 |
4 | South Dakota | 8 | 0.86 | 8,110 | 871.1 | 12 | 5.4 | - | 467.69 |
5 | Washington | 81 | 1.01 | 47,880 | 594.1 | 121 | 10.3 | No limit to sick time used | 455.85 |
6 | Missouri | 72 | 1.15 | 42,880 | 682.5 | 91 | 7.5 | Up to 56 (15+ employees) | 445.88 |
7 | Montana | 14 | 1.22 | 8,660 | 757.5 | 8 | 5.6 | - | 425.12 |
8 | Idaho | 17 | 0.84 | 12,010 | 591.0 | 25 | 7.2 | - | 412.60 |
9 | Michigan | 142 | 1.39 | 63,550 | 623.2 | 180 | 6.7 | Up to 40 (<10 employees), Up to 72 (10+ employees) | 404.52 |
10 | New Mexico | 64 | 2.99 | 14,240 | 665.6 | 18 | 5.4 | Up to 64 | 400.36 |
11 | Kansas | 26 | 0.87 | 17,790 | 595.0 | 37 | 7.3 | - | 399.10 |
12 | West Virginia | 10 | 0.57 | 9,860 | 557.2 | 74 | 6.7 | - | 395.09 |
13 | California | 85 | 0.21 | 245,790 | 619.7 | 255 | 12.6 | Up to 40 | 390.41 |
14 | Louisiana | 31 | 0.67 | 31,060 | 674.1 | 107 | 8.3 | - | 387.33 |
15 | Wisconsin | 60 | 1.00 | 39,660 | 661.9 | 111 | 7.7 | - | 381.58 |
16 | Minnesota | 132 | 2.26 | 42,750 | 732.9 | 73 | 6 | Up to 48 | 374.94 |
17 | Oklahoma | 35 | 0.85 | 21,070 | 510.6 | 60 | 8.9 | - | 373.57 |
18 | Kentucky | 51 | 1.10 | 26,440 | 571.5 | 117 | 8 | - | 362.34 |
19 | New Hampshire | 19 | 1.34 | 8,700 | 614.5 | 158 | 5.5 | - | 357.66 |
20 | Indiana | 76 | 1.09 | 43,340 | 621.9 | 195 | 8.6 | - | 354.31 |
21 | Arizona | 138 | 1.79 | 36,900 | 479.7 | 68 | 6 | Up to 24 (<15 employees), Up to 40 (15+ employees) | 353.93 |
22 | Ohio | 113 | 0.95 | 72,410 | 606.3 | 292 | 7.9 | - | 346.83 |
23 | Utah | 63 | 1.77 | 24,160 | 677.9 | 43 | 5.9 | - | 343.38 |
24 | Arkansas | 40 | 1.29 | 16,040 | 516.2 | 60 | 8.3 | - | 341.41 |
25 | Alaska | 93 | 12.50 | 5,270 | 708.6 | 1 | 5.3 | Up to 40 (<15 employees), Up to 56 (15+ employees) | 339.61 |
26 | Massachusetts | 112 | 1.55 | 55,160 | 765.5 | 924 | 6.8 | Up to 40 (11+ employees) | 338.79 |
27 | Delaware | 12 | 1.12 | 7,980 | 747.6 | 548 | 7.3 | - | 338.61 |
28 | Maryland | 143 | 2.27 | 37,740 | 598.2 | 650 | 6.3 | Up to 64 hours used per year, but only up to 40 hours accrued per year | 321.18 |
29 | Florida | 261 | 1.09 | 126,070 | 528.8 | 445 | 7.9 | - | 319.98 |
30 | Wyoming | 22 | 3.73 | 4,150 | 703.2 | 6 | 4.8 | - | 319.15 |
31 | Maine | 74 | 5.25 | 9,490 | 672.9 | 46 | 5.3 | Up to 40* | 307.05 |
32 | Georgia | 147 | 1.30 | 51,210 | 453.3 | 196 | 8.8 | - | 304.98 |
33 | Hawaii | 34 | 2.34 | 10,390 | 716.1 | 226 | 3.7 | - | 302.54 |
34 | New York | 747 | 3.74 | 186,630 | 933.3 | 424 | 6.9 | Up to 40 (5–99 employees or <5 employees but net income >$1M per year), | 302.43 |
35 | South Carolina | 85 | 1.53 | 30,100 | 540.4 | 185 | 7.8 | - | 302.31 |
36 | Texas | 504 | 1.58 | 174,690 | 548.4 | 122 | 8.1 | - | 302.20 |
37 | Iowa | 83 | 2.54 | 25,970 | 795.5 | 58 | 7.4 | - | 301.54 |
38 | Vermont | 67 | 10.34 | 4,760 | 734.3 | 70 | 5.8 | Up to 40 | 299.81 |
39 | Illinois | 296 | 2.32 | 97,850 | 765.8 | 230 | 8.7 | Up to 40* | 293.06 |
40 | Pennsylvania | 250 | 1.90 | 89,500 | 681.1 | 294 | 7.8 | - | 270.21 |
41 | New Jersey | 233 | 2.42 | 65,580 | 681.6 | 1,308 | 8.1 | Up to 40 | 269.61 |
42 | Alabama | 108 | 2.08 | 25,460 | 489.8 | 103 | 8.6 | - | 267.57 |
43 | Rhode Island | 32 | 2.85 | 6,300 | 561.9 | 1,084 | 6 | Up to 40 (18+ employees) | 267.04 |
44 | Nevada | 102 | 3.07 | 32,210 | 970.0 | 30 | 8.2 | Up to 40* | 263.85 |
45 | Oregon | 204 | 4.75 | 22,000 | 512.7 | 45 | 12.1 | Up to 40 | 263.59 |
46 | Connecticut | 237 | 6.39 | 30,460 | 821.7 | 766 | 7.8 | Up to 40 | 240.32 |
47 | Virginia | 354 | 3.98 | 58,910 | 662.8 | 225 | 6.7 | - | 233.74 |
48 | Mississippi | 136 | 4.62 | 16,120 | 547.8 | 63 | 8.7 | - | 228.92 |
49 | North Carolina | 391 | 3.49 | 56,240 | 501.7 | 231 | 6.7 | - | 223.13 |
50 | Tennessee | 414 | 5.67 | 36,450 | 498.8 | 177 | 7 | - | 211.30 |
The 15 U.S. Cities With the Most OSHA Sanitation Violations per Capita
| City | Population | OSHA Sanitation Violations | Sanitation Violations per 100,000 People |
1 | Jackson, TN | 69,303 | 16 | 23.09 |
2 | Richmond, VA | 233,655 | 46 | 19.69 |
3 | Albany, NY | 101,317 | 18 | 17.77 |
4 | Jackson, MS | 141,449 | 23 | 16.26 |
5 | Chattanooga, TN | 191,496 | 28 | 14.62 |
6 | Eugene, OR | 178,786 | 26 | 14.54 |
7 | Bridgeport, CT | 151,599 | 21 | 13.85 |
8 | New Haven, CT | 137,562 | 18 | 13.09 |
9 | Concord, NC | 124,016 | 16 | 12.90 |
10 | Wilmington, NC | 125,284 | 16 | 12.77 |
11 | Anchorage, AK | 289,600 | 33 | 11.40 |
12 | Memphis, TN | 610,919 | 67 | 10.97 |
13 | Birmingham, AL | 196,357 | 20 | 10.19 |
14 | Paterson, NJ | 160,463 | 16 | 9.97 |
15 | Buffalo, NY | 276,617 | 26 | 9.40 |
Methodology
The Workplace Cleanliness Index analyzes five different metrics to determine which states have the cleanest and dirtiest workplaces in America. Each state could earn up to 100 points for each metric, aside from the first metric which was worth double, for a maximum of 600 points towards the Workplace Cleanliness Score.
Rate of OSHA Sanitation Violations per Capita – The number of annual OSHA-issued sanitation violations in permanent workplaces in the state per 100,000 people.
The top metric used to determine the states with the cleanest workplaces was the rate of sanitation violations issued by OSHA at workplaces in each state. The score for this metric was given double weight when calculating the final Workplace Cleanliness Score.
Per Capita Rate of Janitors and Cleaners – The number of janitors and cleaners, excluding maids and housekeeping cleaners, employed in each state per 100,000 people.
The second metric analyzed was the per capita rate of janitors and cleaners to determine the ratio of the state population to those whose jobs involve cleaning up after employees in workplaces.
Population Density – The number of people living per square mile in each state.
Population density is the third metric included, as higher population density often correlates with increased waste, pollution, and unsanitary conditions.
Air Pollution – The average daily density of fine particulate matter in micrograms per cubic meter (PM2.5).
The amount of air pollution is the fourth metric included in the index. Higher levels of air pollution can indicate poor waste management and unsanitary conditions, which in turn affect air quality in workplaces.
State Mandated Sick Leave Laws – The hours of sick time that the state mandates employees can use and accrue per year.
The fifth metric analyzed was sick leave laws mandated by each state to determine the number of hours employees can use for sick time per year. Over half of U.S. states do not have mandatory sick leave laws in place. When states lack mandatory paid sick leave, employees are more likely to work while sick, thereby spreading illness.
Sources
OSHA Sanitation Violations: https://enforcedata.dol.gov/views/data_catalogs.php
Janitorial and Cleaning Staff Employment: https://www.bls.gov/oes/2023/may/oessrcst.htm
Paid Sick Leave Laws: https://www.dol.gov/sites/dolgov/files/WB/StatePaidSickLeaveLaws.pdf
Population Density: https://worldpopulationreview.com/state-rankings/state-densities
Air Pollution: https://hdpulse.nimhd.nih.gov/data-portal/home